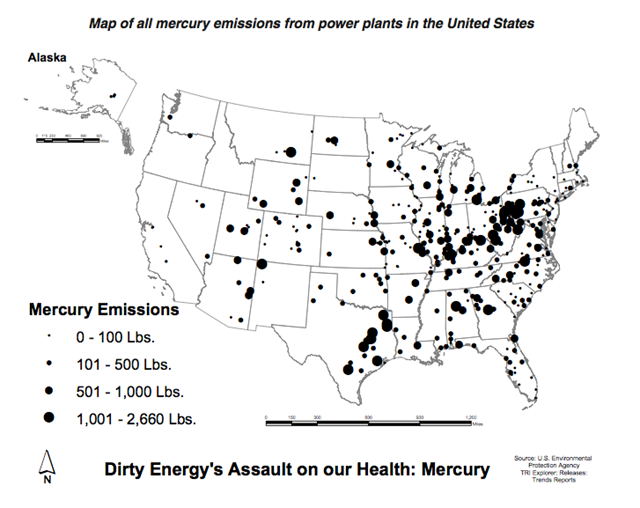
Graph of the Day: Map of All Mercury Emissions from U.S. Coal-fired Power Plants, November 2011
By Sue Sturgis
2 November 2011 Rank of coal-fired power plants among America’s biggest sources of air pollution: 1 Of the five leading causes of death in the United States, number to which coal plant pollution contributes: 4 Number of U.S. water bodies impaired by mercury, a particularly toxic component of coal plant pollution: 3,781 Of the 50 U.S. states, number that have fish consumption advisories due to unsafe mercury pollution levels: 50 Factor by which one study found mercury concentrations in fish have increased from the 1930s to today: 10 Portion of U.S. women of childbearing age who have enough mercury in their bloodstream to put their offspring at risk of health effects: 1 in 6 Percentage of U.S. women of childbearing age that had inorganic mercury in their blood in 1999: 2 That percentage in 2006: 30 Amount of mercury deposited in a mid-sized lake over the course of a year that was enough to account for all of the mercury subsequently found in the lake’s fish: 1 gram, or 0.0022 pounds Amount of mercury released by U.S. coal-fired power plants in 2009: 134,365 pounds […] For every 1,000 pounds of mercury released to the environment, increase in the rate of special education services in Texas: 43 percent In the rate of autism: 61 percent […] (All of the figures in this index and the map above come from Dirty Energy’s Assault on Our Health: Mercury, Environment America, January 2011.)
