Graph of the Day: Cumulative Rainfall Anomalies for Southeastern Australia, January 1997 – December 2011
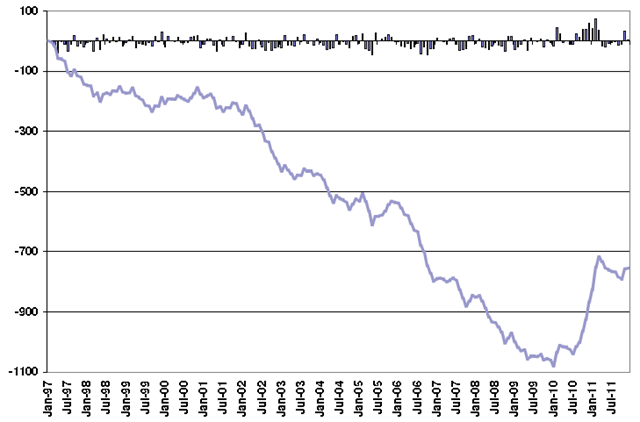
Cumulative rainfall anomalies for southeastern Australia starting from January 1997 to December 2011 in mm. Individual monthly anomalies are shown in the columns. An alternative way to consider the impact of the rainfall declines and recent rainfall is to look at the cumulative rainfall anomalies for southeastern Australia. The cumulative rainfall anomalies provide a measure of just how much rainfall the region has ‘missed out on’ in the past 15 years. While the systematic accumulation of rainfall deficits was reversed with the heavy spring and summer rainfall of 2010, the total two-year record rainfall makes up for about one third of the total rainfall ‘missed out on’ since 1996. Additionally, the recovery peaked in autumn 2011, with a return to deficits from that time on. In other words, the accumulated below-normal rainfall during the ‘Big Dry’ remains substantially greater than the extra spring and summer rainfall that has fallen during the past two years.
SPECIAL CLIMATE STATEMENT 38: Australia’s wettest two-year period on record; 2010–2011 [pdf]