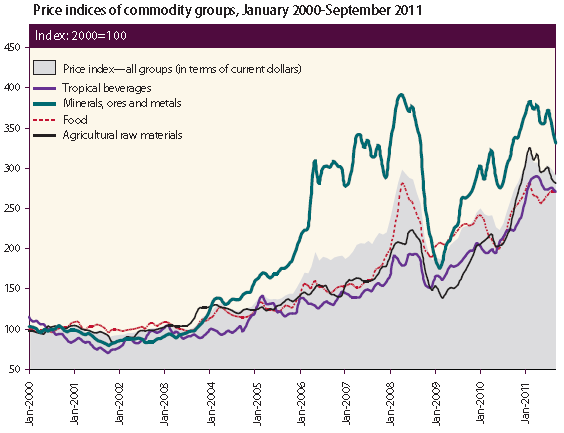
Graph of the Day: Price Indices of Commodity Groups, January 2000 – September 2011
After sliding considerably in the first half of 2010, the agricultural commodity price indices of the United Nations Conference on Trade and Development (UNCTAD) rose sharply, reaching peaks around February 2011 (figure II.9). Despite subsequent falls, prices remain comparatively high. The food price index averaged 268 points from January to September 2011, up 21.8 per cent from the same period in 2010. Within this category, the average price of the main cereals (wheat, maize, and rice) has continued its upward movement, although rising at a slower pace than in the previous year. Meat, vegetable oils, and sugar prices have also been on the rise. The impact on net food-importing countries has been considerable, but variable. For example, the Horn of Africa was hit by famine following prolonged drought, compounded by conflict and insecurity, while other countries in Africa enjoyed good harvests of maize and sorghum. In developing Asia, in particular, rising prices for wheat, edible oil and other food items have been a major factor in accelerating headline inflation.Where food price increases were contained by food subsidies, they have given rise to widening fiscal deficits, as was the case in Western Asia. The outlook for wheat crops in 2012 is uncertain. Increased production projections for the European Union (EU) and the Commonwealth of Independent States (CIS), together with competitive prices relative to maize, may continue to encourage the use of wheat for livestock feed, which could push up prices. The sugar price may continue its rise in 2012, underscored by higher projected world demand for refined sugar in the light of anticipated market deficits. The tropical beverages price index, which has risen steadily since December 2010, may show moderation as a result of better-than-expected supply conditions. The vegetable oilseeds and oil price index has declined from its all-time high of February 2011, but price volatility may continue amidst uncertain supply and demand prospects in major oilseed-producing and -importing countries. The average price index for agricultural raw materials increased by 91 points over the first three quarters of 2011 compared with the same period in 2010, mostly as a result of supply shortfalls generated by adverse weather conditions and strong demand in Asian emerging economies. Natural rubber prices remained high in 2011 owing to strong demand for tyres in emerging market economies and high energy costs (especially crude oil) which affected synthetic rubber prices. Supply disruptions from poor weather conditions in major producing countries also contributed to increased prices. [My emphasis.] This pattern was evident for cotton, too, which reached a historic high in March 2011 ($2.3 per lb), up 63 per cent from its 2009 average.
World Economic Situation and Prospects 2012 [pdf]
