Graph of the Day: Distribution of Temperature Anomalies for 11-year periods, 1951-2010
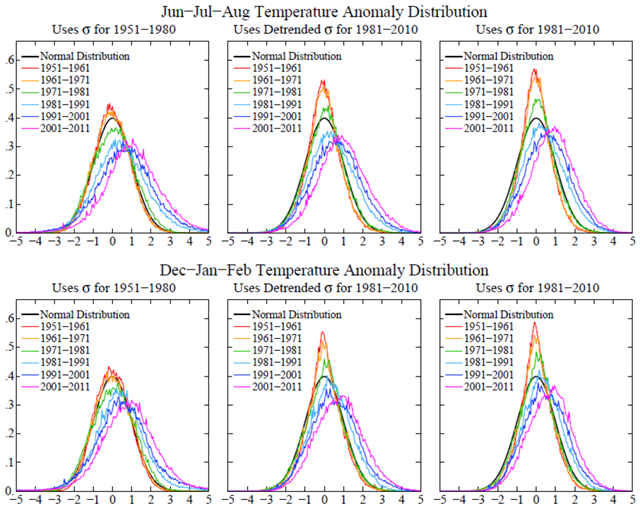
Abstract: The “climate dice” describing the chance of an unusually warm or cool season, relative to the climatology of 1951-1980, have progressively become more “loaded” during the past 30 years, coincident with increased global warming. The most dramatic and important change of the climate dice is the appearance of a new category of extreme climate outliers. These extremes were practically absent in the period of climatology, covering much less than 1% of Earth’s surface. Now summertime extremely hot outliers, more than three standard deviations (σ) warmer than climatology, typically cover about 10% of the land area. Thus there is no need to equivocate about the summer heat waves in Texas in 2011 and Moscow in 2010, which exceeded 3σ – it is nearly certain that they would not have occurred in the absence of global warming. If global warming is not slowed from its current pace, by mid-century 3σ events will be the new norm and 5σ events will be common. […] The distribution of Jun-Jul-Aug and Dec-Jan-Feb temperature anomalies divided by the standard deviation for 11-year periods beginning in 1951 is shown in Figure 4 for the three choices of standard deviation in Figure 2. For comparison the normal (a.k.a. Gaussian or bell-curve) distribution of anomalies is shown by the black line. The data curves were obtained by binning the local anomalies divided by local standard deviation into intervals of 0.05 The data for 1951-1980 happen to fit the normal distribution best when the standard deviation includes the effect of unrealistically small Southern Ocean variability (left column in Figures 2 and 4), as the data artifact broadens the distribution of anomaly divided by standard deviation. More realistic standard deviations based on 1981-2010 data yield a frequency distribution for observed temperature anomalies that is more peaked at small anomalies than the normal distribution. Observed anomalies in the base period have a smaller chance of being in the range 1-3σ than for the normal distribution. The important point is the large shift of the probability distribution function toward the right in each successive decade in the past 30 years. The distribution also becomes broader in recent decades. The frequency of occurrence of 3σ, 4σ and 5σ anomalies, close to zero in 1951-1980, is substantial in the past decade, consistent with the large brown areas in Figure 3. The frequency of seasons colder than the 1951-1980 average temperature (cases with σ < 0 in Figure 4) is much smaller than it was in 1951-1980, but it is still far from zero.
Climate Variability and Climate Change: The New Climate Dice [pdf]