Graph of the Day: Area Covered by Temperature Anomalies, 1900-2010
By J. Hansen, M. Sato, and R. Ruedy
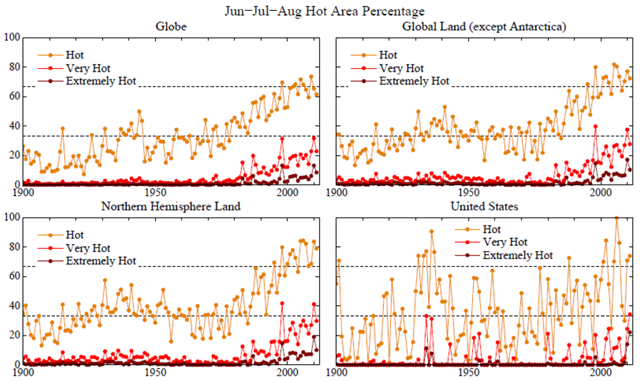
10 November 2011 Abstract: The “climate dice” describing the chance of an unusually warm or cool season, relative to the climatology of 1951-1980, have progressively become more “loaded” during the past 30 years, coincident with increased global warming. The most dramatic and important change of the climate dice is the appearance of a new category of extreme climate outliers. These extremes were practically absent in the period of climatology, covering much less than 1% of Earth’s surface. Now summertime extremely hot outliers, more than three standard deviations (σ) warmer than climatology, typically cover about 10% of the land area. Thus there is no need to equivocate about the summer heat waves in Texas in 2011 and Moscow in 2010, which exceeded 3σ – it is nearly certain that they would not have occurred in the absence of global warming. If global warming is not slowed from its current pace, by mid-century 3σ events will be the new norm and 5σ events will be common. […] The most important change is the emergence of the new category of “extremely hot” summers, more than 3σ warmer than climatology. The frequency of these extreme anomalies shown in Figure 5 is calculated for the entire area (land and ocean) that has data. However, for practical purposes it is more important to look at the changes over land areas, where most people live, as shown in Figure 6 for Jun-Jul-Aug temperature anomalies. “Extremely hot” (temperature anomaly exceeding +3σ) almost never occurred during 1951-1980, as shown in Figure 6 for the mid-decade years of the 1950s, 1960s and 1970s. In the past several years the area covered with extreme anomalies, exceeding +3σ, has been of the order of 10% of the land area. The increase, by more than a factor 10, of area covered by these extreme anomalies reflects the shifting of the distribution of anomalies over the past 30 years of global warming, as shown in the prior figures, most succinctly in Figure 4. One implication of this shift is that the extreme anomalies in Texas in 2011, in Moscow in 2010, and in France in 2003 almost certainly would not have occurred in the absence of the global warming with its resulting shift of the distribution of anomalies. In other words, we can say with a high degree of confidence that these extreme anomalies were a result of the global warming. Jun-Jul-Aug data on a longer time scale, specifically 1900-present, and different spatial scales are shown in Figure 7. The frequency of extreme anomalies is only slightly larger for land than for land plus ocean, because temperature variability is smaller over the ocean, thus largely compensating for the smaller warming over the ocean. Restricting the data to Northern Hemisphere land, thus restricting the data to summer, also has rather little effect. Nevertheless, these minor adjustments have an impact on the “climate dice” that people living in the Northern Hemisphere must deal with in the remainder of the current decade. The graph in the lower left of Figure 7 suggests that in this decade 5 of the 6 sides of the dice (~83% probability) will be red (“hot”). More important, two of these sides (~33% probability) will be at least into the category of dark red (“very hot”, > +2σ) relative to the climatology of 1951-1980. Most important, the chances of an “extremely hot” summer (> +3σ, represented by brownish-red) seems likely to increase to the point of earning one side of the dice (~17% probability).
Climate Variability and Climate Change: The New Climate Dice [pdf]