Graph of the Day: Projected Change in Consecutive Dry Days, 2046-2100
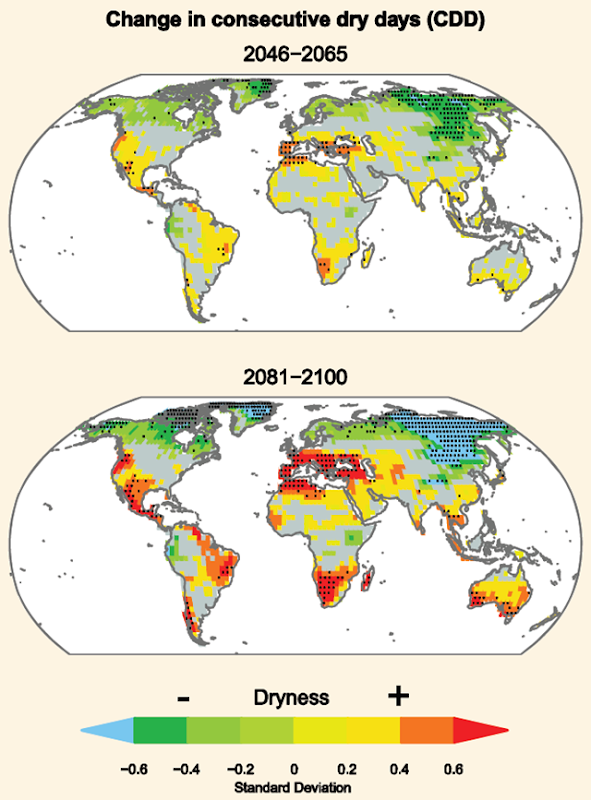
Projected annual changes in dryness assessed from change in annual maximum number of consecutive dry days (CDD, days with precipitation <1 mm). Increased dryness is indicated with yellow to red colors; decreased dryness with green to blue. Projected changes are expressed in units of standard deviation of the interannual variability in the three 20-year periods 1980-1999, 2046-2065 and 2081-2100. The figure shows changes for two time horizons, 2046-2065 and 2081-2100, as compared to late-20th-century values (1980–1999), based on GCM simulations under emissions scenario SRES A2 relative to corresponding simulations for the late-20th-century. Results are based on 17 (CDD) and 15 (SMA) GCMs contributing to the CMIP3. Colored shading is applied for areas where at least 66% (12 out of 17 for CDD, 10 out of 15 for SMA) of the models agree in the sign of the change; stippling is added for regions where at least 90% (16 out of 17 for CDD, 14 out of 15 for SMA) of all models agree in the sign of the change. Grey shading indicates where there is insufficient model agreement (<66%).
Managing the Risks of Extreme Events and Disasters to Advance Climate Change Adaptation [pdf]