Researchers provide detailed picture of ice loss following collapse of Antarctic ice shelves
Contact: Patrick Lynch, NASA’s Goddard Space Flight Center, Greenbelt, Md., 757-897-2047, patrick.lynch@nasa.gov
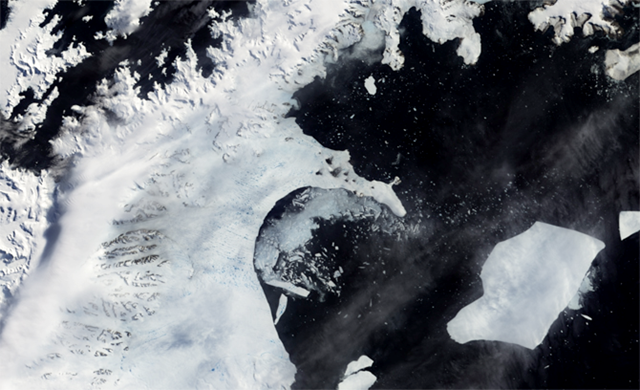
25 July 2011 An international team of researchers has combined data from multiple sources to provide the clearest account yet of how much glacial ice surges into the sea following the collapse of Antarctic ice shelves. The work by researchers at the University of Maryland, Baltimore County (UMBC), the Laboratoire d’Etudes en Géophysique et Océanographie Spatiales, Centre National de la Recherche Scientifique at the University of Toulouse, France, and the University of Colorado’s National Snow and Ice Data Center, Boulder, Colo., details recent ice losses while promising to sharpen future predictions of further ice loss and sea level rise likely to result from ongoing changes along the Antarctic Peninsula. “Not only do you get an initial loss of glacial ice when adjacent ice shelves collapse, but you get continued ice losses for many years — even decades — to come,” says Christopher Shuman, a researcher at UMBC’s Joint Center for Earth Systems Technology (JCET) at NASA’s Goddard Space Flight Center, Greenbelt, Md. Shuman is lead author of the study published online July 25 in the Journal of Glaciology. “This further demonstrates how important ice shelves are to Antarctic glaciers.” An ice shelf is a thick floating tongue of ice, fed by a tributary glacier, extending into the sea off a land mass. Previous research showed that the recent collapse of several ice shelves in Antarctica led to acceleration of the glaciers that feed into them. Combining satellite data from NASA and the French space agency CNES, along with measurements collected during aircraft missions similar to ongoing NASA IceBridge flights, Shuman, Etienne Berthier, of the University of Toulouse, and Ted Scambos, of the University of Colorado, produced detailed ice loss maps from 2001 to 2009 for the main tributary glaciers of the Larsen A and B ice shelves, which collapsed in 1995 and 2002, respectively. […] The authors’ analysis shows ice loss in the study area of at least 11.2 gigatons (11.2 billion tons) per year from 2001 to 2006. Their ongoing work shows ice loss from 2006 to 2010 was almost as large, averaging 10.2 gigatons (10.2 billion tons) per year. An animation showing ice edge changes for the Larsen B ice shelf and its adjacent tributary glaciers can be viewed at http://svs.gsfc.nasa.gov/goto?3803.
Researchers Provide Detailed Picture of Ice Loss Following Collapse of Antarctic Ice Shelves