Graph of the Day: Total Nitrogen Emissions in Spain During 1990-2006
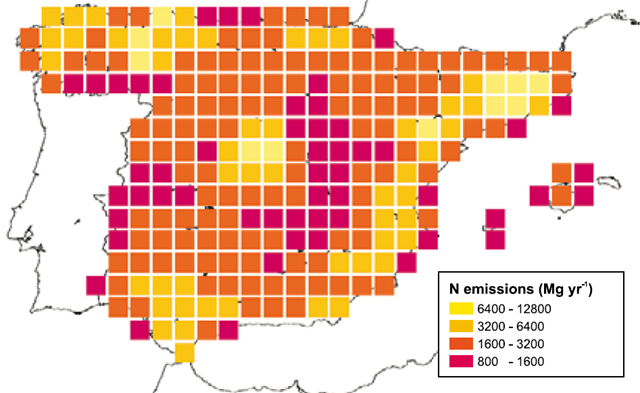
Map of total nitrogen emissions from Spain according to the EMEP model for the period 1990-2006 (data from EMEP reduced to half-degree cell). A nitrophilous index was calculated using over 750,000 occurrence records of plants that had been indexed at GBIF for the Iberian Peninsula by March, 2009. To construct this index, the annual number of records of nitrophilous taxa was obtained for the period 1900-2008. Next, the obtained value was divided by the total number of plant records documented every year, obtaining a nondimensional index representing the proportion of nitrophilous plants for each year of study. These data, along with the latitude and longitude values, were used to elaborate nitrophilous index anomaly maps for the whole twentieth century. Data from recent years (1990-2008) was contrasted against the 1900-1989 baseline of previous records. The records were pooled into centered half-degree cells. Grid cells were coloured as a function of the nitrophilous index or the increase or decrease in percentage of nitrophilous plants with respect to the baseline. The emission data model for NOx and NH3 for the period 1990-2006 was downloaded from the EMEP home page (www.emep.int). In this case, longitude/latitude coordinates from EMEP database grid were also converted to centered square half-degree cells. The model’s time precision is yearly, from 1990 onwards. … The bioindicator index developed by the study showed a continuous increase of nitrophilous plants for the period 1900-2008, thus suggesting a change in biodiversity composition related to nitrogen enrichment in ecosystems. This increase seemed to peak in the 1970 and 1980 decades, decreasing slightly in the last decade of the 20th century, and increasing again in the first decade of the 21st century.
Nitrogen Deposition and Natura 2000