Graph of the Day: Reconstructed Sea Level at a North Carolina Salt Marsh, 0-2000 CE
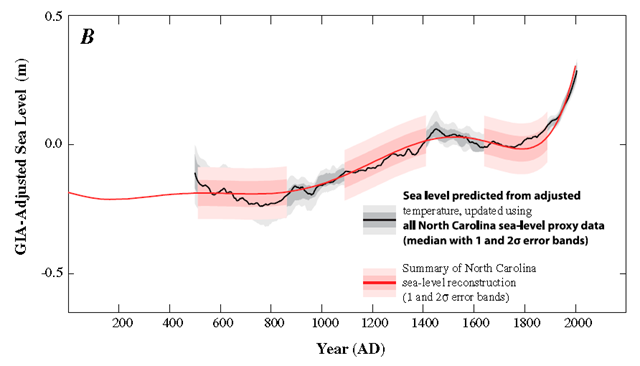
Sea level predicted from paleo-temperature data, using sea-level proxy data from the whole period. Shaded error bands indicate 1σ and 2σ uncertainties. A correction of −0.2 K was applied to temperatures for AD 500–1100. Sea level predicted from adjusted temperature (gray) and summary of proxy-reconstructed sea levels from North Carolina (pink). GIA-adjusted sea level expressed relative to AD 1400–1800 average. We present new sea-level reconstructions for the past 2100 y based on salt-marsh sedimentary sequences from the US Atlantic coast. The data from North Carolina reveal four phases of persistent sea-level change after correction for glacial isostatic adjustment. Sea level was stable from at least BC 100 until AD 950. Sea level then increased for 400 y at a rate of 0.6 mm/y, followed by a further period of stable, or slightly falling, sea level that persisted until the late 19th century. Since then, sea level has risen at an average rate of 2.1 mm/y, representing the steepest century-scale increase of the past two millennia. This rate was initiated between AD 1865 and 1892. Using an extended semiempirical modeling approach, we show that these sea-level changes are consistent with global temperature for at least the past millennium.
Climate related sea-level variations over the past two millennia [pdf]