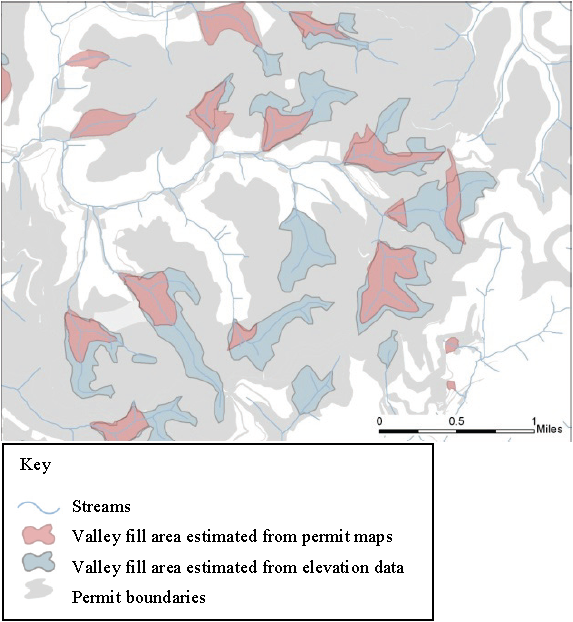
Graph of the Day: Loss of Headwater Streams to Mountaintop Mines and Valley Fills in Central Appalachian Coalfields, 2011
Map showing loss of headwater streams to mountaintop mines and valley fills (MTM-VF). This diagram depicts the loss of stream miles and channel complexity that can result from extensive mountaintop mining and valley filling. Solid blue lines inside valley fill areas represent buried streams. Note that some headwaters above filled areas are disconnected from the rest of the stream network. Source: Modified from Figure 12 in Shank (2004) / EPA At the time of this report, data to quantify the area impacted by valley fill permits approved prior to 1985 or since 2001, or predict cumulative losses from planned MTM-VF activities, are not available in the MTM-VF PEIS or peer-reviewed literature. Data to quantify headwater stream loss by flow duration class (e.g., ephemeral, intermittent, and perennial) are not available; however, in a study of 36 headwater streams in southern West Virginia for which valley fill permits were pending or approved, Paybins (2003) estimated that the median watershed area for intermittent flows was 0.06 km2 (14.5 acres) and the median watershed size for perennial flows was 0.17 km2 (40.8 acres). The same study cites digital geographic information system (GIS) data of valley fills estimated from permit maps by the West Virginia Department of Environmental Protection (WVDEP) showing that the median size of permitted fills in southern West Virginia is 0.05 km2 (12.0 acres, comparable to the median intermittent stream drainage), and the maximum size of permitted fills is 1.94 km2 (480 acres). Statewide averages of valley fill area reported in the MTM-VF PEIS (see Table 1) range from 0.22−0.39 km2 (54.36−97.28 acres). Estimates of valley fill area from both reports suggest that headwaters in all three duration classes are being permitted for burial by valley fills. Valley fill footprints estimated from permit maps may be smaller or larger than the actual fill areas. Some areas approved for fill may not be used; in other cases, areas from permit maps underestimate the actual area of fill.
The Effects of Mountaintop Mines and Valley Fills on Aquatic Ecosystems of the Central Appalachian Coalfields (2011 Final) [pdf]
