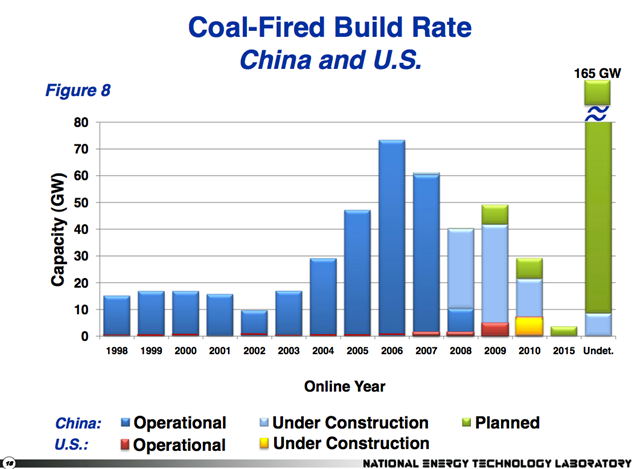
Graph of the Day: Build Rate of Coal-fired Power Plants in China and the US, 1998-2010
By Timothy B. Hurst
August 26, 2010 We hear all kinds of stats thrown around about how much coal-fired electricity generation China has added during its recent period of explosive economic development. The most commonly repeated – and my personal “favorite” – is that China is completing the construction of new coal-fired power plants at a rate of 2-3 per week, a truly astonishing figure. But that statistic alone begs a few questions: 1) How does China’s rate of coal plant construction compare to that of the U.S., the next biggest coal consuming country on the planet? 2) How long will China continue to build at that break-neck pace? The above chart does a phenomenal job of answering both of those questions in graphical form (China in blue; U.S. in red, yellow). While the proliferation of new coal-fired generation in China has subsided, at least somewhat, the legacy of all those hundreds of gigawatts of new plants will be with us for a long time to come. Source: National Energy Technology Laboratory
China’s Massive Coal-Fired Power Plant Boom Visualized
