Annual maximum Arctic sea ice extent reached – Ties lowest on record
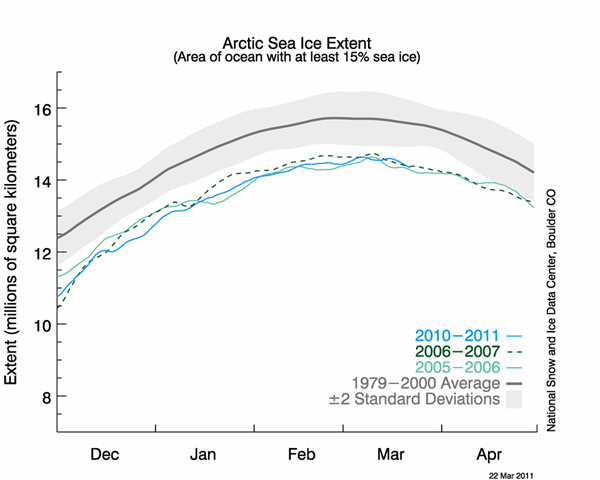
Arctic sea ice extent appeared to reach its maximum extent for the year on March 7, marking the beginning of the melt season. This year’s maximum tied for the lowest in the satellite record. NSIDC will release a detailed analysis of 2010 to 2011 winter sea ice conditions during the second week of April. Overview of conditions On March 7, 2011, Arctic sea ice likely reached its maximum extent for the year, at 14.64 million square kilometers (5.65 million square miles). The maximum extent was 1.2 million square kilometers (471,000 square miles) below the 1979 to 2000 average of 15.86 million square kilometers (6.12 million square miles), and equal (within 0.1%) to 2006 for the lowest maximum extent in the satellite record. Conditions in context As of March 22, ice extent has declined for five straight days. However there is still a chance that the ice extent could expand again. Sea ice extent in February and March tends to be quite variable, because ice near the edge is thin and often quite dispersed. The thin ice is highly sensitive to weather, moving or melting quickly in response to changing winds and temperatures, and it often oscillates near the maximum extent for several days or weeks, as it has done this year. Since the start of the satellite record in 1979, the maximum Arctic sea ice extent has occurred as early as February 18 and as late as March 31, with an average date of March 6. …