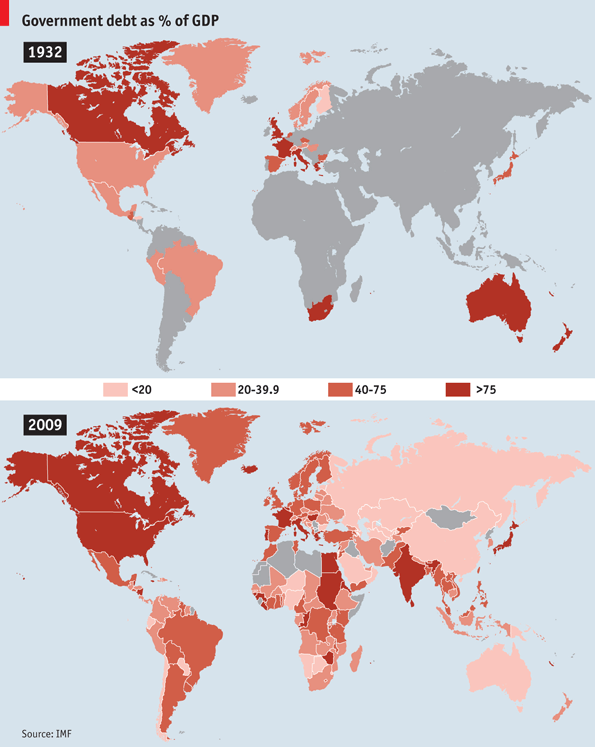
Graph of the Day: Global Government Debt in 1932 and 2009
By The Economist online
Nov 10th 2010, 12:25 GOVERNMENTS have been indebted for centuries, running ongoing Ponzi schemes involving tax-payers, investors and future generations. But data sets on debt levels over time are rare (the most comprehensive ones only begin in the 1970s). A new paper from the IMF seeks to resolve this. Data gathered from a number of different sources allow the fund to give a historical perspective on today’s mounting debt. Over the 218 years for which data on America are available, government debt has averaged just 28% of GDP, peaking at 121% in 1946. The maps compare debt levels in 1932 and 2009. Most countries have become more indebted in the intervening years. In 1932 US debt amounted to 33% of GDP, compared with 84% in 2009. But some, including South Africa, Australia and New Zealand, have gone the other way.