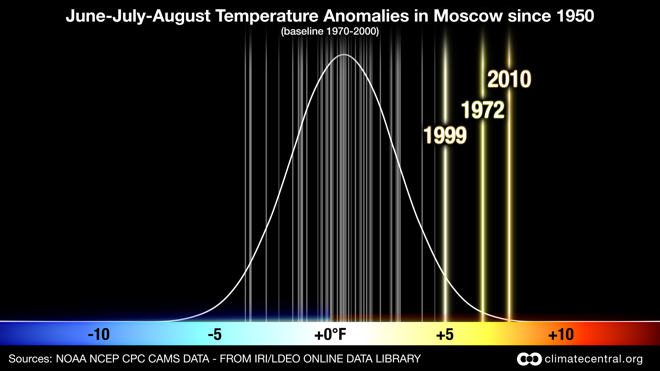
Graph of the Day: Summer Temperature Anomalies in Moscow, 1950-2010
By Heidi Cullen and Claudia Tebaldi
October 27th, 2010 The summer of 2010 brought intensely hot weather to large portions of the northeastern U.S., central Europe, and Russia. Russia was especially hard hit as a heat wave — with daily high temperatures hitting 100°F — contributing to the deaths of as many as 15,000 people in Moscow while wildfires tore across more than 2,900 square miles in the central and western part of the country. Drought accompanied the record high temperatures decimating more than a quarter of Russia’s grain harvest. Economists estimated the grain losses cost the Russian economy upwards of $15 billion dollars. As climate scientists continue to study the underlying dynamics of this extreme heat event in order to better understand the extent to which human-caused climate change may have played a role, we wanted to put the Russian heat wave of 2010 into historical context. With that in mind, we collected temperature data from Moscow for July 2010 as well as summer (June through August 2010) and compared it to every year since 1950. (Our analysis is similar to that employed by Schär et al. in their 2004 Nature paper). We sought an answer to the question: how significant was the departure of the 2010 values from the typical summer temperature in Moscow? We have summarized the behavior of a typical summer in Moscow by a normal (bell) curve with mean and standard deviation derived from the summer temperature anomalies during the period 1970-2000 (the typical choice for current climatology). Compared to that distribution, the values experienced this summer are so unexpected as to be beyond three standard deviations for June, July and August means and four standard deviations for July means from the center of that distribution. …
