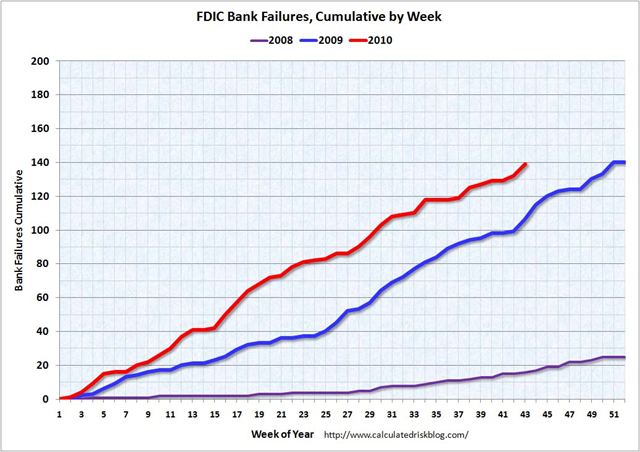
Number of US bank failures: 2010 about to surpass 2009
This graph shows bank failures by week in 2008, 2009 and 2010.
At this time last year, there were 106 bank failures – on the way to 140 total failures in 2009. This year there are 139 failures so far, and, at this pace, it looks like there will be around 175 total failures in 2010. That would be the highest total since the 181 bank failures in 1992.
Bank failures peaked at 534 in 1989 during the S&L crisis. And on total assets from the December Congressional Oversight Panel’s Troubled Asset Relief Program report:[A]lthough the number of failed banks was significantly higher in the late 1980s than it is now, the aggregate assets of failed banks during the current crisis far outweighs those from the 1980s. At the high point in 1988 and 1989, 763 banks failed, with total assets of $309 billion. Compare this to 149 banks failing in 2008 and 2009, with total assets of $473 billion.
Note: This is in 2005 dollars and doesn’t include the failures in 2010 (only estimates are available so far for 2010). However this does include the failure of WaMu in 2008 with $307 billion in assets that didn’t impact the DIF.
