May 3, 2010
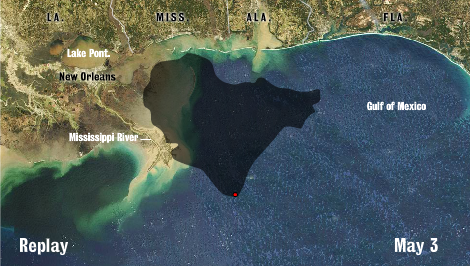
Graph of the Day: BP Deepwater Horizon Oil Spill Extent, 22 April 2010 – 3 May 2010
By Dan Swenson, The Times-Picayune
May 02, 2010, 11:49AM This animation of the Gulf of Mexico oil spill was created using actual overflight information and forecast models from the NOAA and Unified Command. The red dot is the location of the Deepwater Horizon oil well, which exploded on April 20, releasing oil into the Gulf near the Louisiana coast that has yet to be contained. Eleven rig workers died in the explosion. The animation begins April 22, the day the first image of the spill via flyover was released.
Track the Gulf of Mexico oil spill movement in animated graphic
Technorati Tags: oil production,oil spill,pollution,North America,Gulf of Mexico,habitat loss,ecosystem disruption
