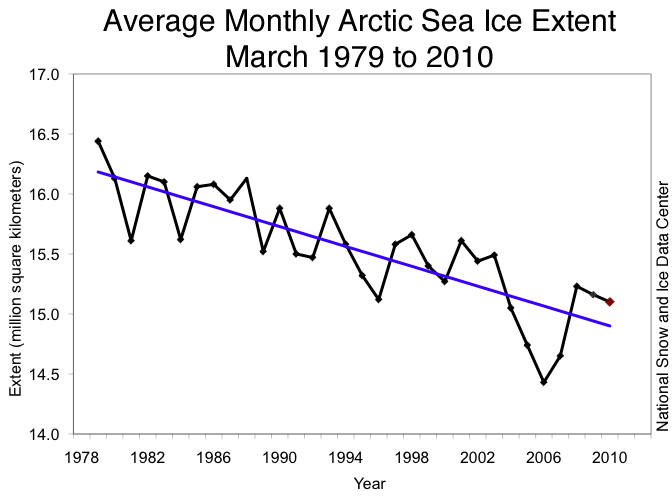
Graph of the Day: Monthly Arctic Sea Ice Extent, March 1979 – 2010
The average ice extent for March 2010 was 670,000 square kilometers (260,000 square miles) higher than the record low for March, observed in 2006. The linear rate of decline for March over the 1978 to 2010 period is 2.6% per decade. Sea ice reached its maximum extent for the year on March 31, the latest maximum date in the satellite record. The previous latest date was on March 29, 1999. The maximum extent was 15.25 million square kilometers (5.89 million square miles). This was 670,000 square kilometers (260,000 square miles) above the record low maximum extent, which occurred in 2006. Sea ice extent seemed to reach a maximum during the early part of the month, but after a brief decline, ice extent increased slowly and steadily through the end of the month. By the end of the month, extent had approached the 1979 to 2000 average. During March 2010, ice extent grew at an average of 13,200 square kilometers (5100 square miles) per day. Usually there is a net loss of ice through the month.
