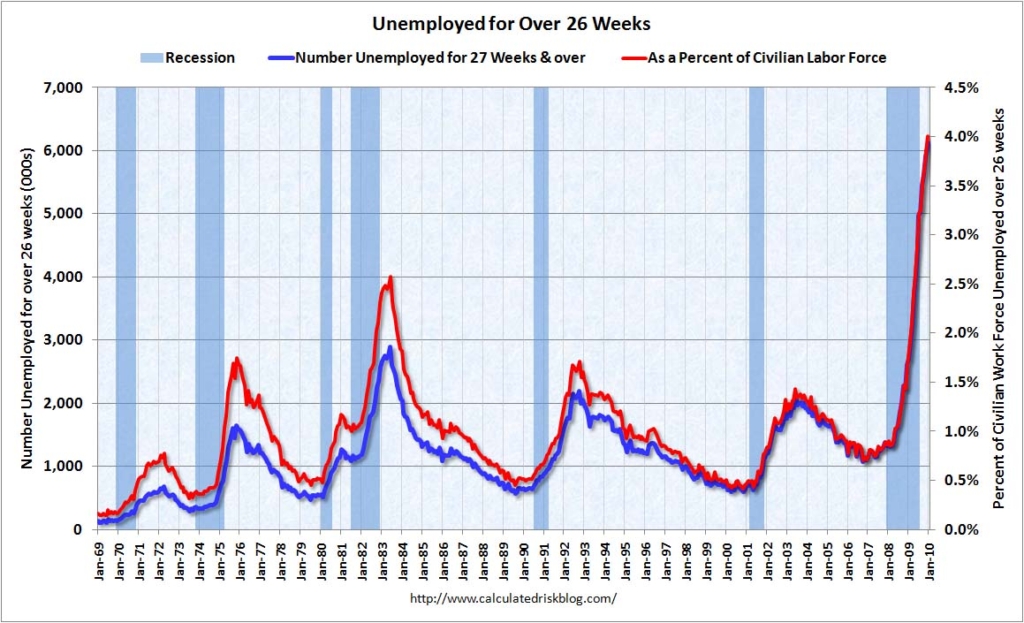
Graph of the Day: Unemployed Over 26 Weeks, 1969-2009
From Calculated Risk: 
The underlying details of the employment report are mostly weak. A couple of exceptions are the manufacturing diffusion index has increased significantly over the last couple of months (see below), and temporary help hiring has been strong (see previous post). Otherwise this report was grim: Average weekly earnings declined. Average weekly hours were flat.
Unemployed over 26 Weeks The blue line is the number of workers unemployed for 27 weeks or more. The red line is the same data as a percent of the civilian workforce. According to the BLS, there are a record 6.13 million workers who have been unemployed for more than 26 weeks (and still want a job). This is a record 4.0% of the civilian workforce (note: records started in 1948). …
Unemployed over 26 Weeks, Diffusion Index, Seasonal Retail Hiring