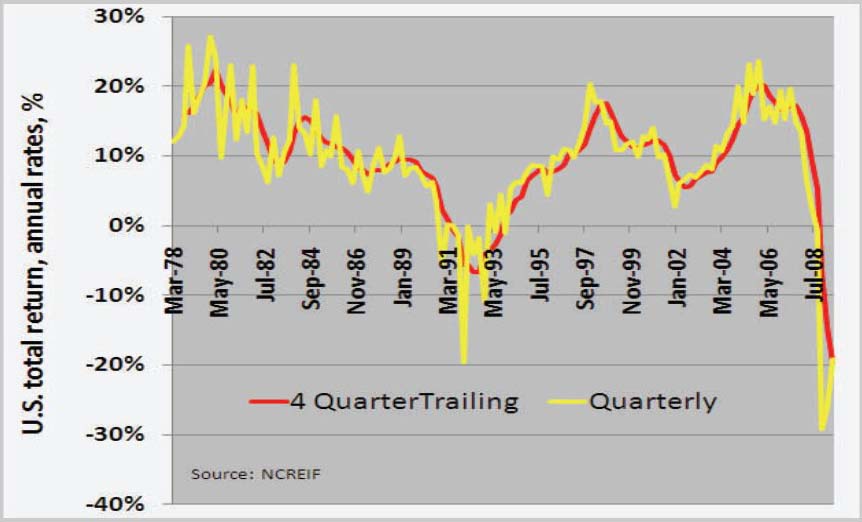
Graph of the Day: U.S. Total Property Returns, 1978-2009
From Calculated Risk: 
The chart shows overall U.S. property total returns, quarterly (at annual rates) and lagging four quarters. This appraisal-based, lagging index shows sharp negative returns exceeding the deterioration of the RTC (Resolution Trust Corp.) period of the early 1990s. Second quarter 2009 returns indicate the possibility that total returns, while still negative, may have hit a point of inflection. We expect that property values in many sectors, especially office, retail, and industrial, will likely deteriorate further in 2010 with improvement beginning sometime in 2011. … A crisis of unprecedented proportions is approaching. Of the $3 trillion of outstanding mortgage debt, $1.4 trillion is scheduled to mature in four years. We estimate another $500 billion to $750 billion of unscheduled maturities (i.e., defaults). Unfortunately, traditional lenders of consequence are practically out of the market and massive amounts of maturing debt will not easily find refinancing. Marking-to-market outstanding debt will render many banks, especially regional and community banks, insolvent, especially as much of the debt is likely worth about 50% of par, or less. The inability of many banks and other capital sources to lend not just to real estate firms but to other businesses in the State as well presents a real challenge to the private sector and state and local governments. …
California Controller: Overview of the Commercial Property Markets