September 9, 2009
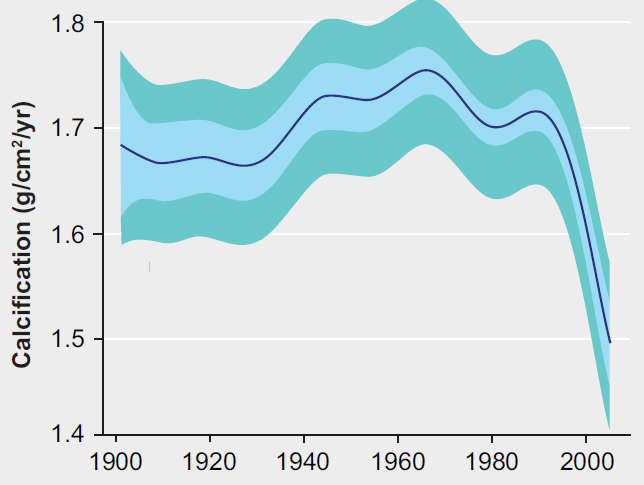
Graph of the Day: Calcification in Great Barrier Reef Coral, 1900-2005
This graph shows an overall decrease in the rate of calcification in Porites corals on the Great Barrier Reef since 1900. Since 1980, there has been a dramatic decrease in the calcification rate, which has been attributed to increasing acidification and increasing sea temperature stress. The light blue bands indicate 95 per cent confidence intervals for comparison between years, and the green bands indicate 95 per cent confidence intervals for the predicted value for any given year. Three hundred and twenty-eight colonies from 69 reefs were sampled throughout the Great Barrier Reef. (g/cm2/yr =grams per square centimetre per year).
