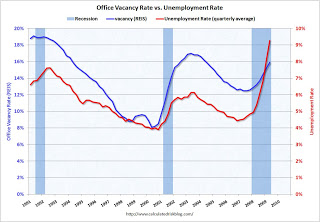
Graph of the Day: Office Vacancy Rate and Unemployment Rate, 1991-2009
From Calculated Risk: 
Last night Reis reported that the U.S. office vacancy rate hit 15.9 percent in Q2. (See Reis: U.S. Office Vacancy Rate Hits 15.9% in Q2 for a graph). This graph shows the office vacancy rate vs. the quarterly unemployment rate and recessions. The unemployment rate and the office vacancy rate tend to move in the same direction – and the peaks and troughs mostly line up.
As the unemployment rate continues to rise over the next year or more, the office vacancy rate will probably rise too. Reis’ forecast is for the office vacancy rate to peak at 18.2 percent in 2010, and for rents to continue to decline through 2011. One of the questions is why – given 9.5% unemployment – the office vacancy rate isn’t even higher? This is probably a combination of less overbuilding as compared to the S&L related overbuilding in the ’80s, and the tech bubble overbuilding a few years ago. And possibly because a higher percentage of construction, manufacturing and retail workers (non-office workers) have lost their jobs in the recession (I’ll have to check that). …
Office Vacancy Rate and Unemployment