May 27, 2009
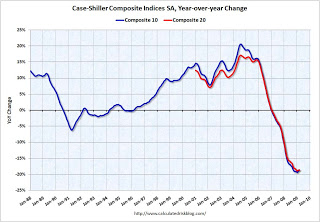
Graph of the Day: Case-Shiller Composite Indices, 1988-2009
From Calculated Risk: 
The graph shows the year-over-year change in both indices. The Composite 10 is off 18.6% over the last year. The Composite 20 is off 18.7% over the last year. This is near the worst year-over-year price declines for the Composite indices since the housing bubble burst started. …
Case-Shiller: Prices Fall Sharply in March
Technorati Tags: financial collapse