March 27, 2009
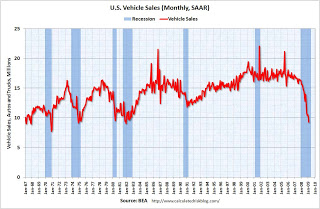
Graph of the Day: US Vehicle Sales, 1967-2009
From Calculated Risk: 
The graph shows monthly vehicle sales (autos and trucks) as reported by the BEA at a Seasonally Adjusted Annual Rate (SAAR). This shows that sales have plunged to a 9.29 million annual rate in February; the lowest since Dec 1981. March 2009 sales will be down sharply from March 2008 too, but analysts will be looking for some stabilization on a seasonally adjusted basis. …
Vehicle Sales: Cliff Diving in February
Technorati Tags: financial collapse