February 25, 2009
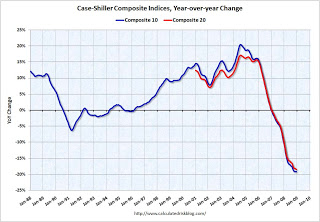
Graph of the Day: Year-over-year change in Case-Shiller Composite Indices, 1988-2008
From Calculated Risk: 
Both the monthly indices (20 cities and 2 composites) and the quarterly national index were released this morning. I’ll have more on the national index shortly. The Composite 10 is off 19.2% over the last year. The Composite 20 is off 18.5% over the last year. These are the worst year-over-year price declines for the Composite indices since the housing bubble burst, although only slightly worse (on a year-over-year basis) than November. …
Case-Shiller: House Prices Decline Sharply in December
Technorati Tags: financial collapse