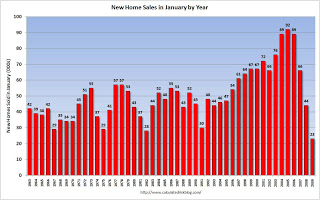
Graph of the Day: New Home Sales, 1963-2009
From Calculated Risk: 
New home sales in January 2009 (309 thousand SAAR) were 10.2% lower than last month, and were 48% lower than January 2008 (597 million SAAR). See link for graphs of sales and inventory.
There was some discussion that the seasonal adjustment might be distorting the sales number. The following graph of the January sales numbers (no adjustment) shows this decline in sales wasn’t a seasonal issue. This graph shows the Census Bureau reported sales for every January since 1963. The label is the sales for the month (in thousands). Clearly January 2009 was the worst ever – and this wasn’t adjusted for changes in population either, and the U.S. population has grown substantially since 1963. …
Summary Post: New Home Sales at Record Low